
So far, we’ve already explored some of the elements Istio provides, such as visualizing our service mesh with Kiali, and monitoring our application metrics with Prometheus and Grafana. In this tutorial, we’ll see how we can use Jaeger with Istio.
Jaeger is a distributed tracing platform. The two keywords are “distributed” and “tracing”. If you work with a distributed system, such as a microservices architecture, you may find out that it’s a pain in the ass to know where an error comes from, certainly if microservices call each other and errors are being propagated. In this case, platforms like Jaeger help, as they provide tracing for those distributed systems.

Enabling tracing
By default, tracing with Istio is disabled. You can enable it by passing the tracing.enabled installation option. Istio also supports multiple tracing platforms, such as Jaeger, Zipkin and LightStep [x]PM. To configure the proper platform, you can use the tracing.provider installation option. By default, this is configured to be Jaeger, so we don’t have to do this.
An important thing to note is that Jaeger only uses 1% of the traffic to sample. If you want to increase that amount, you should configure pilot.traceSampling as well.
In this example, I’ll be using the Istio Helm template to configure Istio:
helm template $ISTIO_RELEASE/install/kubernetes/helm/istio/ \
    --name istio \
    --namespace istio-system \
    --set pilot.traceSampling=10 \
    --set tracing.enabled=true > kubefiles/istio.yml
You can find the Helm template within the Istio release folder ($ISTIO_RELEASE). After generating the Kubefile, you can apply it like this:
kubectl apply -f kubefiles/istio.yml
Once you’ve deployed Istio with Jaeger enabled, you can test it out by opening the dashboard. To open the dashboard, let’s port forward it:
kubectl port-forward -n istio-system svc/jaeger-query 16686:16686
After that, you can visit http://localhost:16686 to open the Jaeger dashboard.
Passing the correlation ID
One way to find a correlation between multiple HTTP requests is through the use of a correlation ID. This ID should be passed to all requests, so that the tracing platform knows which requests belong together.
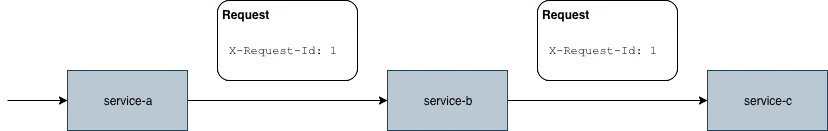
For Istio to work properly, the following headers should be passed through:
x-request-idx-b3-traceidx-b3-spanidx-b3-parentspanidx-b3-sampledx-b3-flagsx-ot-span-context
The Envoy proxy within the Istio sidecar picks up these headers, and passes them to Jaeger.
In my case, I have an application where the frontend is hosted on nginx, while the backend is a Spring boot application. So I have to make sure that the headers mentioned here are passed through with nginx.
The solution to that is by enabling proxy_pass_request_headers, for example:
location /movie-quote-service {
    proxy_pass http://movie-quote-service:8080;
    proxy_http_version 1.1;
    proxy_pass_request_headers on;
    rewrite ^/movie-quote-service(.*)$ $1 break;
}
Viewing the traces
Once you’ve made sure that the correlation ID headers are properly passed through by each application/service within your service mesh, you should be ready to see some traces.
First, let’s generate some traffic. In my Istio setup, I’ve configured pilot.sampleTracing to be 10, which means that I need to fire at least 10 calls (100 / 10 = 10)
So open the Jaeger dashboard again, and now you should be able to see two services in the left sidebar. One should be jaeger-query, while the other should be your application traces.
When you select your application and click the Find traces button, you should be able to see the sampled requests. Once you click on one of these, you can see how it correlates to other requests being made. For example:
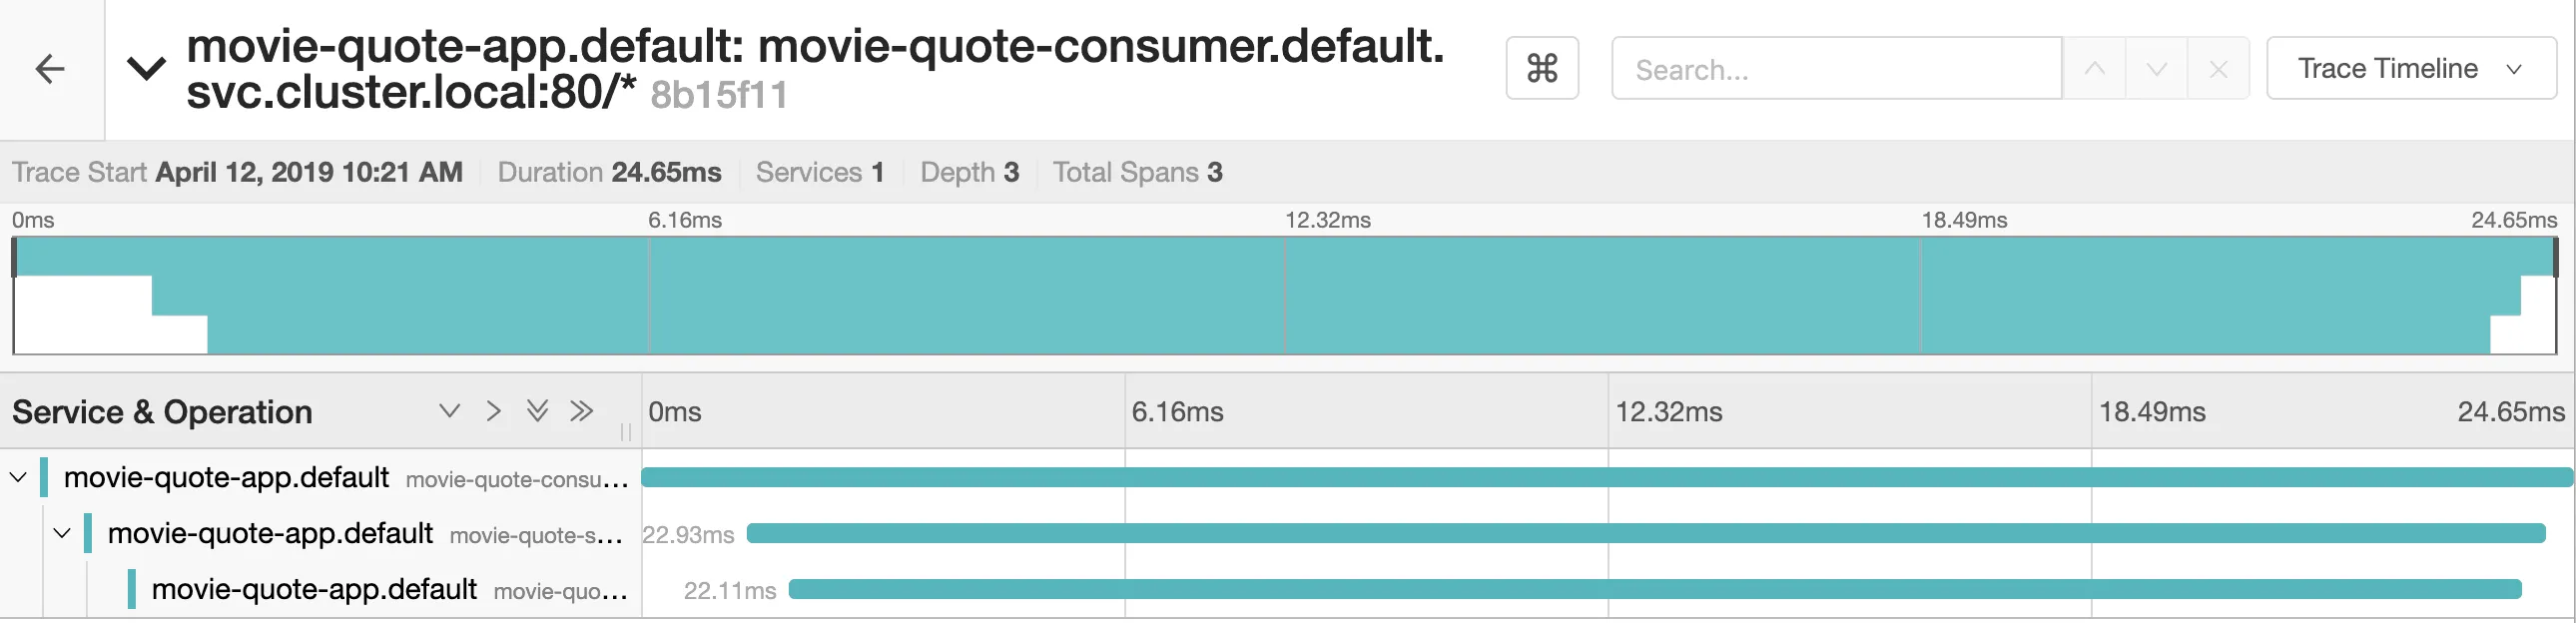
Additionally, if you click the Trace Timeline dropdown at the top right, and click the Trace Graph option, you can see a graph to how your services are connected.

In my case, you can see that the movie-quote-consumer calls the movie-quote-service. But there you have it, you’re now able to see which calls are being made under the hood, and how long each call takes. This allows you to detect failures or performance issues.