
Collecting application metrics with Istio
- July 23rd, 2019
- 2 minute read
- Grafana Istio Kubernetes Prometheus
In my earlier tutorials, I’ve explained how you can set up your own Prometheus and Grafana containers with Docker, and how you can configure them for Spring boot and nginx. A nice feature of Istio, is that it comes with Prometheus and Grafana out of the box. Additionally, they’re already set up to collect certain metrics.
In this tutorial, we’ll integrate our own application metrics with the existing services that are available with Istio.

Enabling Grafana
Even though Istio nicely integrates with Grafana, by default, this feature is turned off. If you’re using Helm templates to set up Istio, you can regenerate your Kubefile using the grafana.enabled configuration parameter:
helm template $ISTIO_RELEASE/install/kubernetes/helm/istio/ \
        --name istio \
        --namespace istio-system \
        --set grafana.enabled=true > kubefiles/istio.yml
Once complete, you can apply these changes by using kubectl:
kubectl apply -f kubefiles/istio.yml
To make sure that Grafana is properly running, you can port-forward the service and visit http://localhost:3000:
kubectl port-forward -n istio-system svc/grafana 3000:3000
Exploring Grafana
If you visit the URL mentioned above, you should be able to see the Grafana home. You should notice that it has already been set up to work properly with Prometheus, and that there are also some dashboard already.
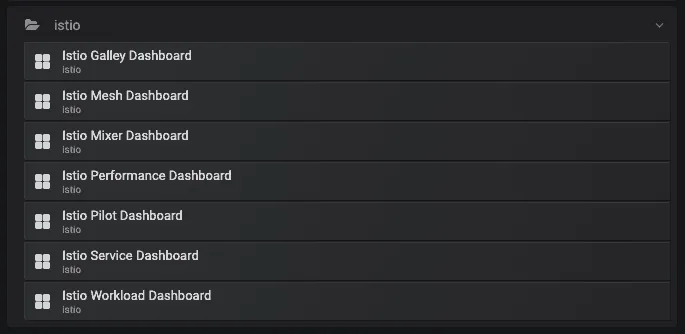
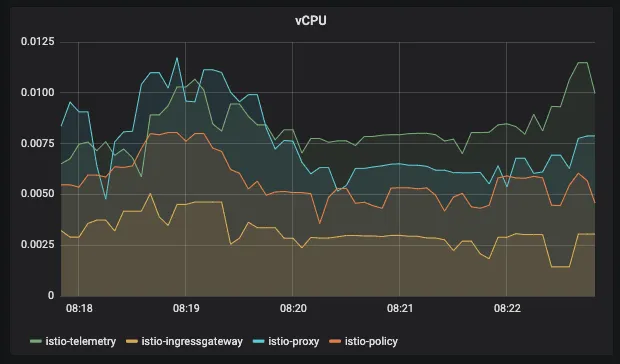
For example, the Istio Performance Dashboard contains some information about your CPU and memory usage.
Adding your own metrics
While Grafana already contains some interesting metrics about Istio itself, it would be great if we could add our own metrics as well. Currently, my application is providing a Prometheus endpoint at /actuator/prometheus.
All you have to do to make this work is to add the following annotations to your deployment:
prometheus.io/scrape: "true"
prometheus.io/path: "/actuator/prometheus"
prometheus.io/port: "8080"
When that’s done, you just re-apply the configuration, and your application metrics should be scraped now.
To verify this, you can port forward the Prometheus dashboard to be sure:
kubectl port-forward -n istio-system svc/prometheus 9090:9090
If you visit http://localhost:9090/targets afterwards, you should be able to find your application between all those other Istio metrics that are being scraped.
Creating your own Grafana dashboard
Now that your endpoints are being scraped, you’re ready to set up a new Grafana dashboard. If you’re still port forwarding Grafana, you should be able to click on the plus-sign to create a new dashboard.
To properly query the right pod, you can use the kubernetes_name tag, for example:
jvm_memory_used_bytes{kubernetes_name="movie-quote-service", area="heap"}
This query will fetch the used heap memory of my application, and now I can properly create a graph for it.
Eventually, you can create dashboards like these:
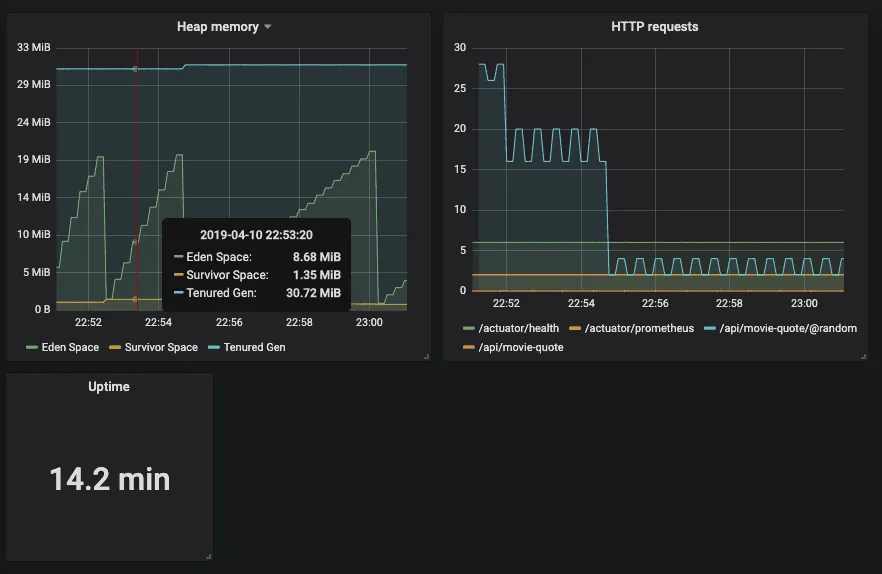
And there you have it, your application is now being properly monitored within your service mesh!