
A while ago, I wrote a tutorial about deploying your static web project on nginx using Docker. Today, we’ll go a bit further, and see how we can monitor what’s happening on nginx, by using Prometheus and Grafana.

Enabling the status endpoint
nginx itself already comes with a status endpoint on its own, which can be enabled using the ngx_http_stub_status_module. To do this, we have to open our nginx.conf and add a separate location:
http {
    index   index.html;
    server {
        location /metrics {
            stub_status on;
        }
    }
}
Using this configuration, we’ll have an endpoint /metrics that will provide us with some information, for example:
Active connections: 5
server accepts handled requests
 5 5 55
Reading: 0 Writing: 1 Waiting: 4
Using the Prometheus exporter
While it’s already great that we have some metrics now, they aren’t ready to be consumed by Prometheus. In order to do that, we have to create a Prometheus-readable endpoint that provides these metrics.
One of the tools we can use to do this is the nginx-prometheus-exporter, which can be ran using Docker, for example:
docker run \
  -p 9113:9113 \
  nginx/nginx-prometheus-exporter:0.2.0 \
  -nginx.scrape.uri=http://path-to-nginx/metrics \
  -nginx.retries=10 \
  -web.telemetry-path=/prometheus
If you’re using Docker Compose or Kubernetes, you can also set these configuration parameters through environment variables. In that case, SCRAPE_URI matches -nginx.scrape.uri, TELEMETRY_PATH matches -web.telemetry-path and NGINX_RETRIES matches nginx.retries.
Another important note is that if you don’t configure the amount of retries, this will likely not work, as by default it won’t retry. This means that if you use Docker compose to start both nginx and the exporter at the same time, the exporter will be killed immediately because it can’t find nginx.
Configuring Prometheus
The next step to get this running is to configure Prometheus properly by adding a target to prometheus.yml. For example:
scrape_configs:
  - job_name: 'movie-quote-consumer'
    scrape_interval: 1m
    metrics_path: '/prometheus'
    static_configs:
      - targets: ['movie-quote-consumer-prometheus:9113']
In this example, I’m running the Prometheus exporter as a container within the same network as Prometheus, and I’m using the movie-quote-consumer-prometheus:9113 alias to connect to it.
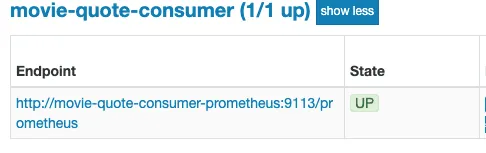
Once your containers are running, you should be able to see whether or not Prometheus is configured properly by visiting the /targets endpoint. This should show the status UP next to the movie-quote-consumer job.
Configuring Grafana
Once you’ve set up Grafana to connect to the Prometheus database, you can set up some dashboards. In this case, I want to show a graph of the total amount of connections that have been made by checking the nginx_http_requests_total property.
Since this property shows a total amount of requests, and I only want to see the total amount of requests for a given time, I need to use the delta() function to measure the difference between certain measurements. For example, if you want to calculate the total amount of requests over a time span of two minutes, you can use:
delta(nginx_http_requests_total{job="movie-quote-consumer"}[2m])
This will result in a graph like this:
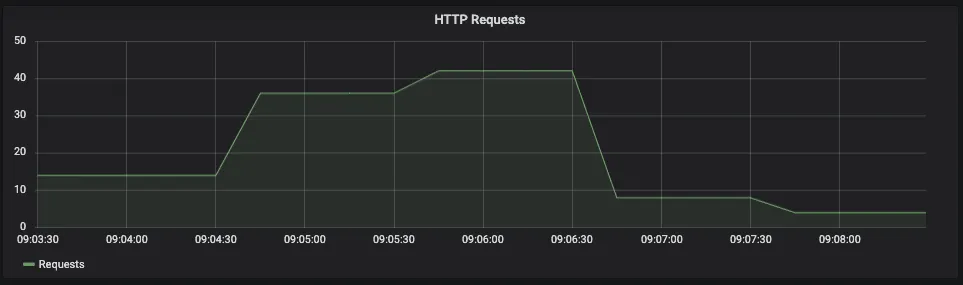
And there you have it, a nice dashboard for nginx. The great thing about this is that if you have nginx plus, the configuration barely changes. You only have to enable the Prometheus exporter to collect metrics for nginx plus by using the -nginx.plus flag. After that, you should be able to use the new metrics within Grafana.