
Monitoring Spring boot applications with Prometheus and Grafana
- February 13th, 2018
- 6 minute read
- Grafana Monitoring Prometheus Spring boot
This article is outdated since the release of Spring boot 2.0. If you’re interested in a more up-to-date setup, make sure to read my new tutorial about monitoring Spring boot applications with Micrometer, Prometheus and Grafana.
Monitoring is an essential aspect to the maintainability of applications, it’s no surprise that there are many platforms out there that allow you to properly monitor your applications. Usually, monitoring platforms work by using a time series database, which is a database optimised for time-based information, such as application metrics. Then on the other hand you have a visualization part, which allows you to show time-based charts to visualize the data.
Some products offer both combined (eg. Graphite, Prometheus), while other platforms either manage the database part (InfluxDB) and other platforms manage the visualization (Grafana). In this example I’ll be combining Prometheus and Grafana and use them to monitor an existing Spring boot application.

Setting up Prometheus and Grafana
Setting up Prometheus and Grafana can be done in various ways. In this example I’ll be using Docker to set up my containers. Both Prometheus and Grafana have their own, official images ready to be used.
The setup I’ll be using is the following:
version: '3.1'
services:
  grafana:
    image: grafana/grafana
    ports:
    - 3000:3000
    volumes:
    - grafana_data:/var/lib/grafana
    environment:
      - GF_SECURITY_ADMIN_PASSWORD=monitoring
      - GF_SECURITY_ADMIN_USER=admin
      - GF_USERS_ALLOW_SIGN_UP=false
    depends_on:
      - prometheus
  prometheus:
    image: prom/prometheus
    ports:
    - 9090:9090
    volumes:
    - ./prometheus.yml:/etc/prometheus/prometheus.yml
    - prometheus_data:/prometheus
    command:
    - --config.file=/etc/prometheus/prometheus.yml
volumes:
  prometheus_data: {}
  grafana_data: {}
As you can see, I’ve configured the Grafana admin username and password to be admin and monitoring respectively (configured using the GF_SECURITY_ADMIN_USER and GF_SECURITY_ADMIN_PASSWORD environment variables). Additionally I’ve set up volumes for both, and an additional configuration file called prometheus.yml to configure Prometheus.
If you’re using Prometheus v1.x, you’ll have to use the -config.file command parameter rather than --config.file.
Configuring Prometheus
Before you run the containers, you need to configure Prometheus. Since Prometheus is our time series database, it has to retrieve the data from somewhere. Prometheus does this by reading specific metrics from an endpoint that has to be implemented on your applications. Prometheus will then retrieve the data from these endpoints on specific intervals, which have to be configured in the prometheus.yml file, an example configuation file could be:
scrape_configs:
  - job_name: 'prometheus'
    scrape_interval: 10s
    static_configs:
      - targets: ['localhost:9090']
  - job_name: 'config-service'
    scrape_interval: 10s
    metrics_path: '/prometheus'
    static_configs:
      - targets: ['192.168.0.114:8000']
  - job_name: 'discovery-service'
    scrape_interval: 10s
    metrics_path: '/prometheus'
    static_configs:
      - targets: ['192.168.0.114:8001']
  - job_name: 'uaa-service'
    scrape_interval: 10s
    metrics_path: '/prometheus'
    static_configs:
      - targets: ['192.168.0.114:8002']
  - job_name: 'blog-service'
    scrape_interval: 10s
    metrics_path: '/prometheus'
    static_configs:
      - targets: ['192.168.0.114:8003']
  - job_name: 'profile-service'
    scrape_interval: 10s
    metrics_path: '/prometheus'
    static_configs:
      - targets: ['192.168.0.114:8004']
  - job_name: 'gateway-service'
    scrape_interval: 10s
    metrics_path: '/prometheus'
    static_configs:
      - targets: ['192.168.0.114:8005']
  - job_name: 'registration-service'
    scrape_interval: 10s
    metrics_path: '/prometheus'
    static_configs:
      - targets: ['192.168.0.114:8006']
  - job_name: 'admin-dashboard'
    scrape_interval: 10s
    metrics_path: '/prometheus'
    static_configs:
      - targets: ['192.168.0.114:8007']
This configuration file will retrieve the data from all my currently running microservices, every 10 seconds. After putting the prometheus.yml and the docker-compose.yml in the same directory you can run it using the following command:
docker-compose up
Adding the /prometheus endpoint to your Spring boot application
One thing you still have to do is to provide those metrics in your Spring boot application. Luckily for us, Prometheus comes with several integration libraries out of the box, one of being the Java client for Spring boot.
All you have to do is to add the following dependencies to your Spring boot application:
<dependency>
    <groupId>io.prometheus</groupId>
    <artifactId>simpleclient_spring_boot</artifactId>
    <version>0.0.26</version>
</dependency>
<dependency>
    <groupId>io.prometheus</groupId>
    <artifactId>simpleclient_hotspot</artifactId>
    <version>0.0.26</version>
</dependency>
<dependency>
    <groupId>io.prometheus</groupId>
    <artifactId>simpleclient_servlet</artifactId>
    <version>0.0.26</version>
</dependency>
Additionally to that, you probably have to add the spring-boot-starter-actuator dependency as well. And to wrap things up, I also defined the following beans to add the endpoint:
@Bean
public SpringBootMetricsCollector springBootMetricsCollector(Collection<PublicMetrics> publicMetrics) {
    SpringBootMetricsCollector springBootMetricsCollector = new SpringBootMetricsCollector(publicMetrics);
    springBootMetricsCollector.register();
    return springBootMetricsCollector;
}

@Bean
public ServletRegistrationBean servletRegistrationBean() {
    DefaultExports.initialize();
    return new ServletRegistrationBean(new MetricsServlet(), "/prometheus");
}
If you run your application now, and visit the /prometheus endpoint, you’ll see that it exposes several metrics already, which are also available though the Spring boot actuator endpoints:
# HELP jvm_memory_bytes_used Used bytes of a given JVM memory area.
# TYPE jvm_memory_bytes_used gauge
jvm_memory_bytes_used{area="heap",} 9.17802E7
jvm_memory_bytes_used{area="nonheap",} 1.09229E8
# HELP jvm_memory_bytes_committed Committed (bytes) of a given JVM memory area.
# TYPE jvm_memory_bytes_committed gauge
jvm_memory_bytes_committed{area="heap",} 2.1495808E8
jvm_memory_bytes_committed{area="nonheap",} 1.1075584E8
Checking, double checking, …
If you have the Docker containers running, you should now be able to visit http://localhost:9090/targets to see if it’s successfully scraping the Prometheus endpoints of your application. For example:
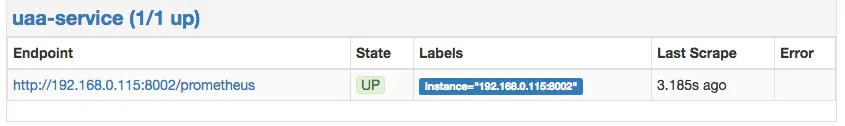
If there are some errors, check if the IP address or hostname within the Prometheus configuration is correct. In some cases, you may also have to disable the servos of Spring boot Actuator to prevent duplicate keys. To do this, you have to add the following property to application.yml (or application.properties):
spring:
  metrics:
    servo:
      enabled: false
If you run the application again, it should work properly again.
Setting up Grafana
The next step is to log on to Grafana. Grafana should be running on port 3000 if you used the same Docker configuration, so by visiting http://localhost:3000/login you should be able to log in as the administrator with the credentials we configured before.
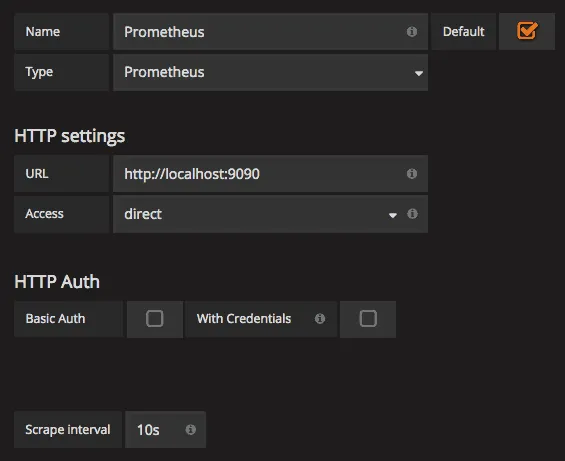
The first step after logging in is to create a datasource, which in our case will be Prometheus. The configuration wizard isn’t too difficult, and for most things you should be able to use the defaults:
Creating your own dashboard
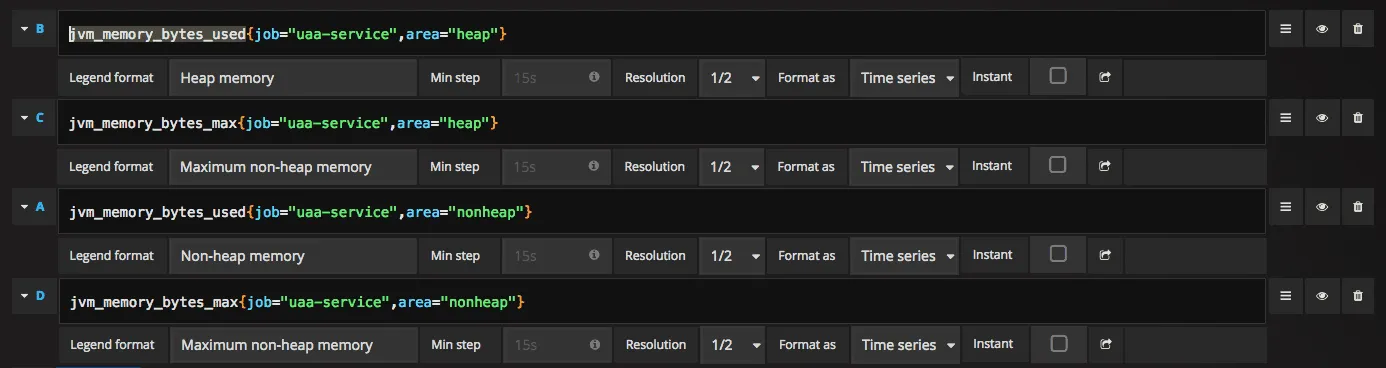
After that, you can create a new dashboard and add a graph to it. If you selected Prometheus as the default datasource, you can now start adding metrics, such as jvm_memory_bytes_used and jvm_memory_bytes_max. This will add a few lines to your graph already, because those metrics have specific properties, such as the job and the area. If you want to retrieve the heap memory of a specific application, you can use jvm_memory_bytes_used{job="uaa-service",area="heap"}. This will allow you to configure things like:
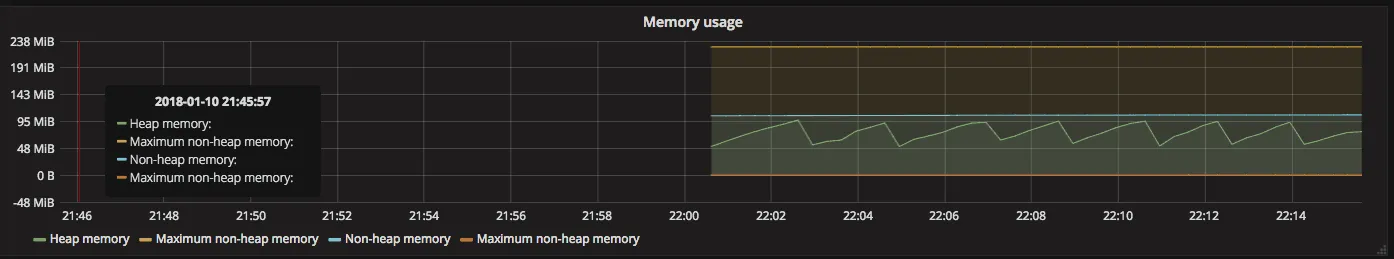
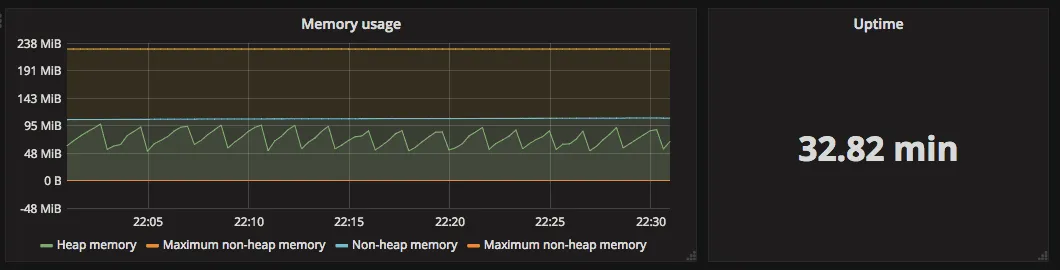
If you save the graph and the dashboard, you can now see you beautiful graphs at work:
With Grafana, you can also configure alerts to be triggered when a metric reaches a certain threshold. This allows you to prevent disasters from happening in our wonderful world of Spring boot applications.
Additionally to graphs, you can also configure single stats, which can be interesting for things like the uptime of the application:
And there you have it, the start of your own dashboard to monitor your own Spring boot applications.
Achievement: Even when things go wrong, you still have a beautiful dashboard!
If you’re seeing this, then it means you successfully managed to make it through this tutorial. If you’re interested in the JSON export of the Grafana dashboard, you can find it on GitHub.