
In several blog posts, I’ve covered how you could develop applications with Spring boot. Developing an application is just one part of the job though. When developed, you also have to run it, and preferably, keep it running.
Did you know that Spring boot provides several features that make it easier to keep an application alive and kicking? In this tutorial, I’ll show how you can use Spring boot actuator.
Since this will be a pretty long tutorial, here are some links to navigate:
- Project setup
- An overview of the features
- Health checks
- Metrics
- Configuring logging levels
- Retrieving the application version
- Enabling HTTP tracing
- Application dumps
- Exposing the actuators over JMX
- Creating your own endpoints
- Securing endpoints
- Conclusion
Project setup
To add these features to your Spring boot project, all you have to do is to add the spring-boot-starter-actuator dependency:
<dependency>
    <groupId>org.springframework.boot</groupId>
    <artifactId>spring-boot-starter-actuator</artifactId>
</dependency>
You can do the same through Spring Initializr, just make sure to add the Spring Boot Actuator dependency.
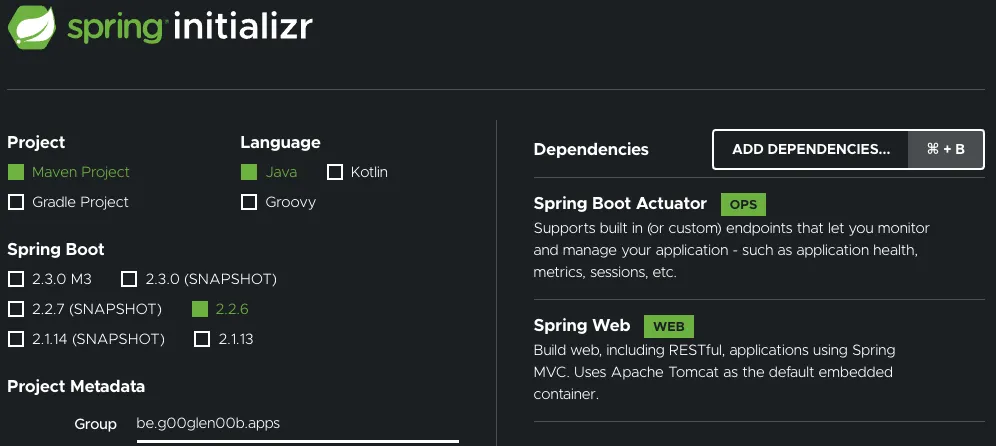
Once that’s done, you’re ready to go!
An overview of the features
If you try to run your application now, and you visit /actuator, you’ll see which features are currently available.
For example:
{
  "_links": {
    "self": {
      "href": "/actuator",
      "templated": false
    },
    "health-path": {
      "href": "/actuator/health/{*path}",
      "templated": true
    },
    "health": {
      "href": "/actuator/health",
      "templated": false
    },
    "info": {
      "href": "/actuator/info",
      "templated": false
    }
  }
}
Now, this isn’t the complete list of all features though. Most features are not exposed by default.
To change what’s exposed, we can configure the management.endpoints.web.exposure.include property within application.properties.
For example, to enable everything you could use:
management.endpoints.web.exposure.include=*
You can also select certain features, by using:
management.endpoints.web.exposure.include=health,info,metrics
This is a list of features that are included:
| ID | Description |
|---|---|
beans | This actuator allows you to show which beans are created. |
caches | This actuator lists all caches, and how they’re performing. |
conditions | This actuator allows you to view the condition evaluation report, which can be used to see which auto-configurations are loaded and which aren’t due to conditions being in place (@ConditionalOnProperty, @ConditionalOnBean, …). |
configprops | Using this actuator, you can see which configuration properties (@ConfigurationProperties) are loaded. |
env | Using this actuator, you can see which properties have been passed to your application (either using environment variables, application.properties, …). |
health | Using this actuator, you can see if your application is running or not and if the resources it requires are available. (e.g. file system, databases, APIs, …) |
heapdump | If you want to get a heap dump of your application without having to set up JMX, you can call this actuator. |
httptrace | Using this actuator, you can view which HTTP requests are being made. |
info | This actuator shows information about your application. |
loggers | This actuator can be used to view which loggers are being used, and what logging level they have. |
mappings | If you want to see which endpoints (@GetMapping, @PostMapping, …) are available in your application, you can use this actuator. |
metrics | If you want to see various metrics related to your application (memory usage, uptime, …), you can use this actuator. |
scheduledtasks | Using this actuator, you can view which tasks have been scheduled. This can be done by annotating your method with @Scheduled or programmatically adding a task to a task executor. |
threaddump | Similar to the heap dump actuator, you can also get a thread dump by using this actuator. |
A complete list can be found within the documentation.
Health checks
One of the first actuators we’re going to explore is the health actuator.
If you open the actuator (/actuator/health), you’ll see that it returns a single status, which could be UP, DOWN, OUT_OF_SERVICE or UNKNOWN.
Depending on the status, the HTTP status of the actuator endpoint will also change:
UPandUNKNOWNwill return 200 OKDOWN, andOUT_OF_SERVICEwill return 503 Service unavailable.
You can also manually change this by configuring the management.endpoint.health.status.http-mapping property.
For example:
management.endpoint.health.status.http-mapping.down=500
The question that remains is, how does Spring boot determine the status? Well, to answer that question, we first have to enable the details:
management.endpoint.health.show-details=always
If you open the /actuator/health endpoint now again, you’ll see a lot more info than before.
For example, if you’re using a database, it will regularly query the database to see if it’s still up and running. In addition, it will check if there’s still enough disk space available and whether the network is accessible and so on.
You can manually enable or disable these health sensors by using:
management.health.db.enabled=false
The root status is an aggregate of all health sensors. The way this works is by prioritizing the statuses like this:
UPUNKNOWNOUT_OF_SERVICEDOWN
Then, it uses the status with the highest priority. For example, let’s say your database is down, but your filesystem is up.
In that case, the status with the highest priority is DOWN, and thus, the aggregate will be DOWN as well.
Even this is configurable by implementing your own HealthAggregator.
The default implementation we just covered is OrderedHealthAggregator.
Custom health checks
If your application is depending on some service that may go down, you could extend the existing health checks with your own!
To do this, you have to implement your own HealthIndicator, and you’re ready!
For example, let’s say our application depends on the GitHub API.
In that case, we could write a HealthIndicator like this:
@Component
@RequiredArgsConstructor
public class GitHubAPIHealthIndicator implements HealthIndicator {
    private final RestTemplate restTemplate;

    @Override
    public Health health() {
        try {
            ParameterizedTypeReference<Map<String, String>> reference = new ParameterizedTypeReference<>() {};
            ResponseEntity<Map<String, String>> result = restTemplate.exchange("https://api.github.com/", HttpMethod.GET, null, reference);
            if (result.getStatusCode().is2xxSuccessful() && result.getBody() != null) {
                return Health.up().withDetails(result.getBody()).build();
            } else {
                return Health.down().withDetail("status", result.getStatusCode()).build();
            }
        } catch (RestClientException ex) {
            return Health.down().withException(ex).build();
        }
    }
}
If we run the application again and check the health actuator, we’ll now see our custom health indicator being integrated:
{
  "status": "UP",
  "components": {
    "gitHubAPI": {
      "status": "UP",
      "details": {
        "current_user_url": "https://api.github.com/user",
        "current_user_authorizations_html_url": "https://github.com/settings/connections/applications{/client_id}",
        "authorizations_url": "https://api.github.com/authorizations"
      }
    }
  }
}
Metrics
The next actuator that may be interesting is the metrics actuator.
If you open the actuator (/actuator/metrics), you’ll see that it provides a list of names.
{
  "names": [
    "jvm.threads.states",
    "jdbc.connections.active",
    "process.files.max",
    "jvm.gc.memory.promoted",
    "jvm.memory.max",
    "jvm.memory.used",
    "system.load.average.1m"
  ]
}
These names are individual metrics that can be checked.
For example, if we want to know more about the memory that’s being used, we want to know more about the jvm.memory.used metric.
In that case, we append the name to the URL, so we get /actuator/metrics/jvm.memory.used.
If you open that URL now, you’ll see the information you’re looking for:
{
  "name": "jvm.memory.used",
  "description": "The amount of used memory",
  "baseUnit": "bytes",
  "measurements": [
    {
      "statistic": "VALUE",
      "value": 220985736
    }
  ],
  "availableTags": [
    {
      "tag": "area",
      "values": [
        "heap",
        "nonheap"
      ]
    },
    {
      "tag": "id",
      "values": [
        "G1 Old Gen",
        "CodeHeap 'non-profiled nmethods'",
        "G1 Survivor Space",
        "Compressed Class Space",
        "Metaspace",
        "G1 Eden Space",
        "CodeHeap 'non-nmethods'"
      ]
    }
  ]
}
In this example, my application appears to be using 210MB of memory. We also see a list of available tags.
These tags allows us to check our memory usage even more in detail.
For example, if we want to know how much of that memory is used on the heap, you could append the tag to the URL (/actuator/metrics/jvm.memory.used?tag=area:heap).
Behind the screens, Spring boot Actuator uses the Micrometer framework, and allow us to define multiple types of metrics, such as counters, gauges, timers and distribution summaries.
Counters
The first type of metric we’re going to investigate are the counters. Counters represent a single numeric value that can be increased. An example of this would be the number of times a method is invoked and so on.
For example, let’s say we have the following API to create a profile:
@PostMapping("/api/profile")
public ProfileDTO create(@RequestBody NewProfileDTO newProfile) {
    return facade.create(newProfile);
}
If we want to count how many times this method has been invoked, we first have to define the Counter:
@Configuration
public class ProfileMetricsConfiguration {
    @Bean
    public Counter createdProfilesCounter(MeterRegistry registry) {
        return Counter
            .builder("api.profiles.created")
            .description("Amount of profiles created")
            .register(registry);
    }
}
Once that’s done, we can autowire the Counter into our controller and change our method like this:
@PostMapping
public ProfileDTO create(@RequestBody NewProfileDTO newProfile) {
    createdProfilesCounter.increment();
    return facade.create(newProfile);
}
If we run our application now, we can access our new counter by visiting /actuator/metrics/api.profiles.created.
Depending on the amount of times you invoked the method, you’ll see the following information:
{
  "name": "api.profiles.created",
  "description": "Amount of profiles created",
  "baseUnit": null,
  "measurements": [
    {
      "statistic": "COUNT",
      "value": 1.0
    }
  ],
  "availableTags": [

  ]
}
Gauges
One downside of the counter we just used is that when we restart the application, the counter will be zero again. If we’re interested in the total amount of profiles that have been created so far, this approach won’t work.
A meter that is more suitable to measure the current state is a gauge.
For example, let’s say we have a count() method that returns the total amount of profiles that have been created.
In that case, we could define a gauge like this:
@Bean
public Gauge countProfilesGauge(MeterRegistry registry, ProfileRepository profileRepository) {
    return Gauge
        .builder("api.profiles.count", profileRepository::count)
        .description("Amount of existing profiles")
        .register(registry);
}
If we run our application now and visit /actuator/metrics/api.profiles.count, we’ll see it in action:
{
  "name": "api.profiles.count",
  "description": "Amount of existing profiles",
  "baseUnit": null,
  "measurements": [
    {
      "statistic": "VALUE",
      "value": 4.0
    }
  ],
  "availableTags": [

  ]
}
Even if we restart our application now, the value will remain, since we’re calling the database to get the number of created profiles.
Timers
While the previous meters were great for measuring values, sometimes you want to measure how long it takes for something to happen. For example, if we return back to our profile API, how long does it generally take to create a new profile?
Well, to find out, we have to define a Timer first:
@Bean
public Timer createdProfileTimer(MeterRegistry registry) {
    return Timer
        .builder("api.profiles.created.time")
        .description("Time taken to create a profile")
        .register(registry);
}
Once done, we can inject it into the controller we wrote and apply it to our method:
@PostMapping
@SneakyThrows
public ProfileDTO create(@RequestBody NewProfileDTO newProfile) {
    return createdProfileTimer.recordCallable(() -> facade.create(newProfile));
}
A Timer provides several methods to track how long it takes to execute certain methods.
One of these methods is the recordCallable() method which will time how long it takes to invoke the method.
In addition, it will also return the value from the method that has been invoked. If you’re not interested in the return value, you could use createdProfileTimer.record().
The nice part is that these timers use functional interfaces, so you can write a nice one-liner using lambdas.
One downside is that recordCallable throws a checked exception (Exception), so you’ll have to either throw or catch the exception itself.
In my case, I decided to use Lomboks @SneakyThrows annotation to wrap this exception within an unchecked exception.
If we run our application now and check /actuator/metrics/api.profiles.created.time, we’ll see something like this:
{
  "name": "api.profiles.created.time",
  "description": "Time taken to create a profile",
  "baseUnit": "seconds",
  "measurements": [
    {
      "statistic": "COUNT",
      "value": 7.0
    },
    {
      "statistic": "TOTAL_TIME",
      "value": 0.062684897
    },
    {
      "statistic": "MAX",
      "value": 0.051106508
    }
  ],
  "availableTags": [

  ]
}
In addition to returning the total time it took to invoke this method, it also returns the maximum amount it took for a single call to complete, and the number of times it was invoked.
Percentiles and SLAs
Sometimes, you’re not only interested in how long it took to execute a method, but you also want to know how often it was walled within a certain time range.
For example, if we have to make sure that most profiles are created within 10 milliseconds, we could define the following SLAs:
@Bean
public Timer createdProfileTimer(MeterRegistry registry) {
    return Timer
        .builder("api.profiles.created.time")
        .description("Time taken to create a profile")
        .sla(Duration.ofMillis(10))
        .register(registry);
}
If we run the application now, we’ll have an api.profiles.created.time.histogram metric next to api.profiles.created.time.
If we call /actuator/metrics/api.profiles.created.time.histogram?tag=le:0.01, we can see how many of our calls actually happened in 10 milliseconds or less.
Alternatively, you can also measure individual percentiles. For example:
@Bean
public Timer createdProfileTimer(MeterRegistry registry) {
    return Timer
        .builder("api.profiles.created.time")
        .description("Time taken to create a profile")
        .sla(Duration.ofMillis(10))
        .minimumExpectedValue(Duration.ofMillis(1))
        .maximumExpectedValue(Duration.ofSeconds(2))
        .publishPercentiles(0.5, 0.95)
        .publishPercentileHistogram()
        .register(registry);
}
This will measure both the median value as the 95th percentile.
You can find out their values by calling /actuator/metrics/api.profiles.created.time.percentile?tag=phi:0.5 and /actuator/metrics/api.profiles.created.time.percentile?tag=phi:0.95 respectively.
Distribution summaries
The last type of metric I want to cover is the distribution summary. In short, the distribution summary is the same as a timer, but for measurement other than time-based measurements.
For example, when creating a profile, people have to provide their birthdate. We could use a distribution summary to see how many profiles have an age below 20, 50 and 100.
To do so, you first have to define a DistributionSummary:
@Bean
public DistributionSummary ageDistributionSummary(MeterRegistry registry) {
    return DistributionSummary
        .builder("api.profiles.age")
        .description("Age of created profiles")
        .sla(20, 50, 100)
        .register(registry);
}
Now you can autowire it within your controller and record the age of the profiles being created:
ageDistributionSummary.record(ChronoUnit.YEARS.between(newProfile.getBirthDay(), LocalDate.now()));
What’s important to note is that distribution summaries expire over time. This happens because metrics are supposed to be continuously measured and because we’re likely more interested in the current situation rather than the situation of years ago.
The default expiry happens after two minutes and allows a buffer of three items. This should be plenty of time for monitoring software to pick it up and store it.
If not, you can configure the expiry by yourself:
@Bean
public DistributionSummary ageDistributionSummary(MeterRegistry registry) {
    return DistributionSummary
        .builder("api.profiles.age")
        .description("Age of created profiles")
        .sla(20, 50, 100)
        .distributionStatisticExpiry(Duration.ofMinutes(5)) // Add this
        .distributionStatisticBufferLength(100) // Add this
        .register(registry);
}
Using metrics with monitoring systems
As mentioned before, the main goal of the metrics endpoint is to be consumed by a monitoring system or time-series database.
Examples of these are Prometheus, Graphite, New Relic and so on. Micrometer flawlessly integrates with most of these, usually by adding a dependency. A full list of supported monitoring systems can be found within the documentation.
I also used Spring boot with Prometheus and Grafana before, read more about it here.
Configuring logging levels
A third actuator I want to talk about in this tutorial is the loggers endpoint.
If we take a look at the /actuator/loggers path, we see that each logger is listed:
{
  "levels": [
    "OFF",
    "ERROR",
    "WARN",
    "INFO",
    "DEBUG",
    "TRACE"
  ],
  "loggers": {
    "ROOT": {
      "configuredLevel": "INFO",
      "effectiveLevel": "INFO"
    },
    "be": {
      "configuredLevel": null,
      "effectiveLevel": "INFO"
    },
    "be.g00glen00b": {
      "configuredLevel": null,
      "effectiveLevel": "INFO"
    },
    "be.g00glen00b.apps": {
      "configuredLevel": null,
      "effectiveLevel": "INFO"
    }
  }
}
In addition, we can also check the logging level for an individual logger, by appending its name to the path.
For example, if we call /actuator/loggers/be.g00glen00b.apps, we’ll see:
{
  "configuredLevel": null,
  "effectiveLevel": "INFO"
}
What I didn’t mention yet is that you can also change the logging level.
For example, if we want to change the logging level of be.g00glen00b.apps, we can send a POST call to the URL we just used.
If we want to change the logging level to WARN, we can use the following payload:
{
  "configuredLevel": "WARN"
}
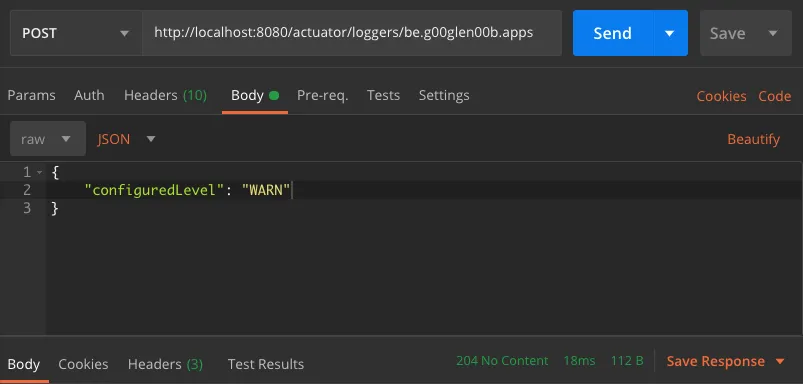
This will immediately take effect, so new messages using a logging level of INFO or lower will no longer appear.
This can be very useful for troubleshooting, and you want to change the logging levels to debug without having to restart the application.
Be aware, as soon as you restart the application, any change you made to the logging levels will be gone.
In addition, if you want to reset the logging level back to the original value, you can use a null value for the configuredLevel.
For example:
{
  "configuredLevel": null
}
Retrieving the application version
One actuator endpoint that appears to be quite empty is the /actuator/info endpoint.
If you call this endpoint, you’ll see that it returns an empty JSON object ({}) and nothing else.
The purpose of this endpoint is that it allows you to provide additional information through the use of application properties.
Let’s say we have the following property:
info.foo=bar
If we restart the application now and we check the /actuator/info endpoint again, we can see that the response changed to:
{
  "foo": "bar"
}
While this specific property isn’t very useful, it can become very interesting if you use it in combination with Maven’s resource filtering.
By default, Maven will automatically replace placeholders defined within any file within the src/main/resources folder.
This allows us to define a property like this:
info.project-version=@project.version@
If we restart the application now, and look at the /actuator/info endpoint, the project version will be included as well.
{
  "foo": "bar",
  "project-version": "0.0.1-SNAPSHOT"
}
This can be very useful to make sure that your application is running on the correct version for a specific environment.
Retrieving the build timestamp
Another useful property we could add is when the build was made.
First, let’s add a proper date format to pom.xml:
<properties>
    <maven.build.timestamp.format>yyyy-MM-dd HH:mm:ss</maven.build.timestamp.format>
</properties>
After that, we can include the build timestamp like this:
info.build-timestamp=@maven.build.timestamp@
And there you have it, now you’re not only able to view the version of your application, but also the timestamp of when it was built.
{
  "foo": "bar",
  "project-version": "0.0.1-SNAPSHOT",
  "build-timestamp": "2020-03-30 17:47:30"
}
Enabling HTTP tracing
One actuator that isn’t enabled by default (not even when using the asterisk wildcard), is the HTTP tracing actuator.
To enable this actuator, you have to add a bean of type HttpTraceRepository.
Luckily, Spring already provides an implementation that uses an in-memory storage (InMemoryHttpTraceRepository).
@Bean
public InMemoryHttpTraceRepository httpTraceRepository() {
    return new InMemoryHttpTraceRepository();
}
Since it uses an in-memory list, it’s likely to have an impact on the overall performance. For that reason, it’s not recommended to be used in a production environment.
Instead of that, you can implement your own HttpTraceRepository or take a look at Spring Cloud Sleuth for distributed tracing.
When we run our application now, and check the /actuator/httptracing endpoint, we’ll see that it contains information on the last 100 requests.
{
  "traces": [
    {
      "timestamp": "2020-03-30T17:26:42.803463Z",
      "principal": null,
      "session": null,
      "request": {
        "method": "GET",
        "uri": "http://localhost:8080/actuator/httptrace",
        "headers": {
          "sec-fetch-mode": [
            "navigate"
          ],
          "referer": [
            "http://localhost:8080/actuator"
          ],
          "sec-fetch-site": [
            "same-origin"
          ]
        }
      }
    }
  ]
}
By default, it includes which request and response headers have been set, which cookies are being used and how long it took to execute the request.
You can change this behavior by configuring the management.trace.http.include property. Possible values are request-headers, response-headers, cookie-headers, authorization-header, principal, remote-address, session-id and time-taken.
For example:
management.trace.http.include=request-headers,time-taken,session-id
Application dumps
Two interesting actuators for taking a closer look at your application are the /actuator/threaddump and the /actuator/heapdump endpoints.
The first one gives an insight into which threads are currently running.
{
  "threads": [
    {
      "threadName": "Reference Handler",
      "threadId": 2,
      "blockedTime": -1,
      "blockedCount": 7,
      "waitedTime": -1,
      "waitedCount": 0,
      "lockName": null,
      "lockOwnerId": -1,
      "lockOwnerName": null,
      "daemon": true,
      "inNative": false,
      "suspended": false,
      "threadState": "RUNNABLE",
      "priority": 10
    }
  ]
}
Since the response is formatted as JSON, it may not be that useful since it can’t be imported into tools to visualize.
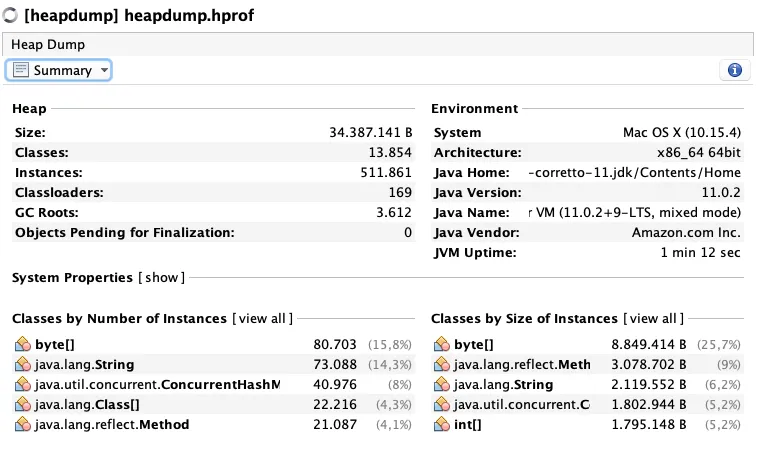
For that reason, the /actuator/heapdump endpoint is a lot more interesting.
When calling this endpoint, a complete *.HPROF file is downloaded.
This file can then be imported within a tool like VisualVM or JProfiler to see exactly what’s happening.
This can be a great tool to use when looking for memory leaks or other performance-related issues.
Exposing the actuators over JMX
So far, we’ve seen how we can use Spring boot Actuator through its REST/Web API. However, Spring boot Actuator also allows you to expose these endpoints over JMX.
One way to access these JMX endpoints is by using VisualVM. VisualVM has a plugin called VisualVM-MBeans that allows you to call a JMX endpoint.
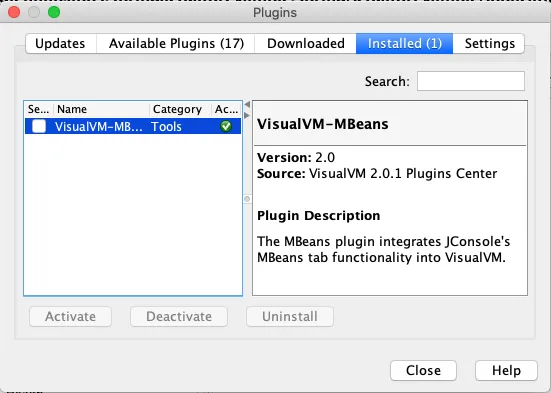
Once installed, you can connect to any application that exposes JMX, and open the MBeans tab.
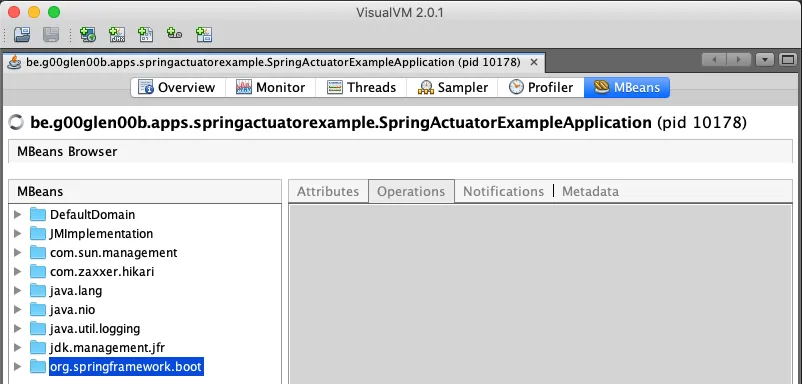
Now you can open org.springframework.boot and explore any of the actuators within the Endpoint folder.
For example, this is the output of the Info JMX MBean:
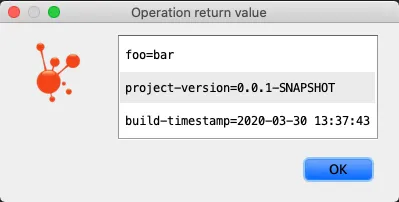
Sadly, neither JConsole nor VisualVM supports complex parameters. That means that it’s not possible to use these tools to explore a specific metric.
Creating your own endpoints
So far, we’ve seen how to use most actuator endpoints, but did you know this system is very extensible? In addition to the available actuators, we can even create our own endpoints.
To do this, you have to create a Spring bean and annotate it with @Endpoint.
Within this Spring bean, you can define your own methods and annotate them with @ReadOperation, @WriteOperation or @DeleteOperation to make them available.
For example, a simple hello world actuator could be written as:
@Component
@Endpoint(id = "helloworld")
public class HelloWorldEndpoint {
    @ReadOperation
    public Message read() {
        return new Message("Hello world");
    }

    @Getter
    @RequiredArgsConstructor
    public static class Message {
        private final String message;
    }
}
Important to note is that the @Endpoint requires a property called id. This property will be used to determine the name of the actuator.
For example, in this case, we can call /actuator/helloworld, which will return:
{
  "message": "Hello world"
}
The same can be achieved through JMX by calling the Helloworld MBean:
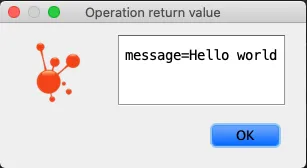
If you only want to target either the web or JMX, you can do so by using @WebEndpoint or @JmxEndpoint.
Securing endpoints
Endpoints within Spring boot Actuator can be secured through Spring Security. Since Spring boot 2.0, adding Spring Security automatically secures the actuator endpoints as well. That means that no special configuration has to be added to secure your actuator endpoints.
However, if necessary, you can always add specific authorizations to access certain endpoints.
@Override
protected void configure(HttpSecurity http) throws Exception {
    http
        .authorizeRequests()
            // For example
            .antMatchers("/actuator/**").hasAuthority("MONITORING")
            .anyRequest().authenticated();
}
In addition, some actuators even provide additional configuration to secure certain features. For example, with the health endpoint, you can configure details to be only accessible when authorized:
management.endpoint.health.show-details=when_authorized
All endpoints can also be individually exposed over the web or not. You can even disable them entirely by using the management.endpoint.{name}.enabled property.
For example:
management.endpoint.info.enabled=false
By default, only the shutdown actuator is disabled. All other endpoints are enabled, but not necessarily exposed over HTTP or JMX.
Conclusion
With that, we’ve now seen why Spring boot’s motto is:
Spring Boot makes it easy to create stand-alone, production-grade Spring based Applications that you can “just run”.
Spring boot not only makes it easier to develop applications, but it also provides tools that are very handy when running in production.
With that, I think I can safely conclude the longest and most detailed tutorial I wrote so far.